I’ve been pretty busy these past two weeks. I’ve been perfecting and gathering more information using my screen scraping code. This means not only information on embedded workflows, beanshells, authors, myExperiment data like the amount of favourites, etc, but pretty much everything else one would like to know about the workflows being uploaded onto myExperiment. Today, as I was trying to find out what ‘views’ and ‘downloads’ entailed on the site, I realised I could scrape more information from the site with a bit of work, so I made this code and integrated it, and then rescraped all of the workflows I’ve been analysing. This gets the amount of views and downloads by members or non members of myExperiment, as well as the same information coming from APIs, project workbenches like Taverna, and direct links. I’d take more credit for this, but all of this information is in the public domain – I’ll I’m doing is scraping it and running stats on what I see. The stat code for the graphs I have is commented and available in my github, as well. I’ve found a few interesting things.
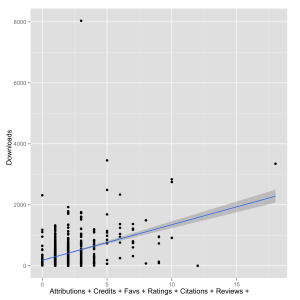
For instance, the amount of exposure a workflow gets on myExperiment is correlated with the amount of downloads. The more favorites, ratings, comments, etc, the more downloads.
 Or, for example, the amount of versions a workflow has is also correlated with the amount of downloads.
 I have over 150 graphs currently waiting to be fully analysed and run over this weekend in California, when we all meet up for the first time to hammer out a paper. This, for the most part, is what I’ve been working on. I still have a few more things to do – analyse the dates, use some regular expressions to really see which tags are best, and that sort of analysis. This week should be very productive.
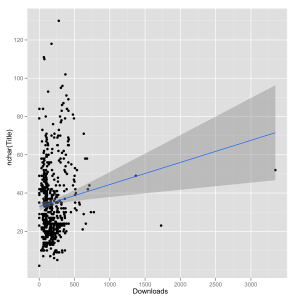
On a somewhat whimsical note, here’s my favourite result so far. The longer your title (for Taverna 2 only), the more downloads. Go figure.

